
A STRONG TRACK RECORD OF PERFORMANCE
The Group has a strong track record of financial performance and is in a strong financial position.
We are well placed to further progress our strategic priorities.
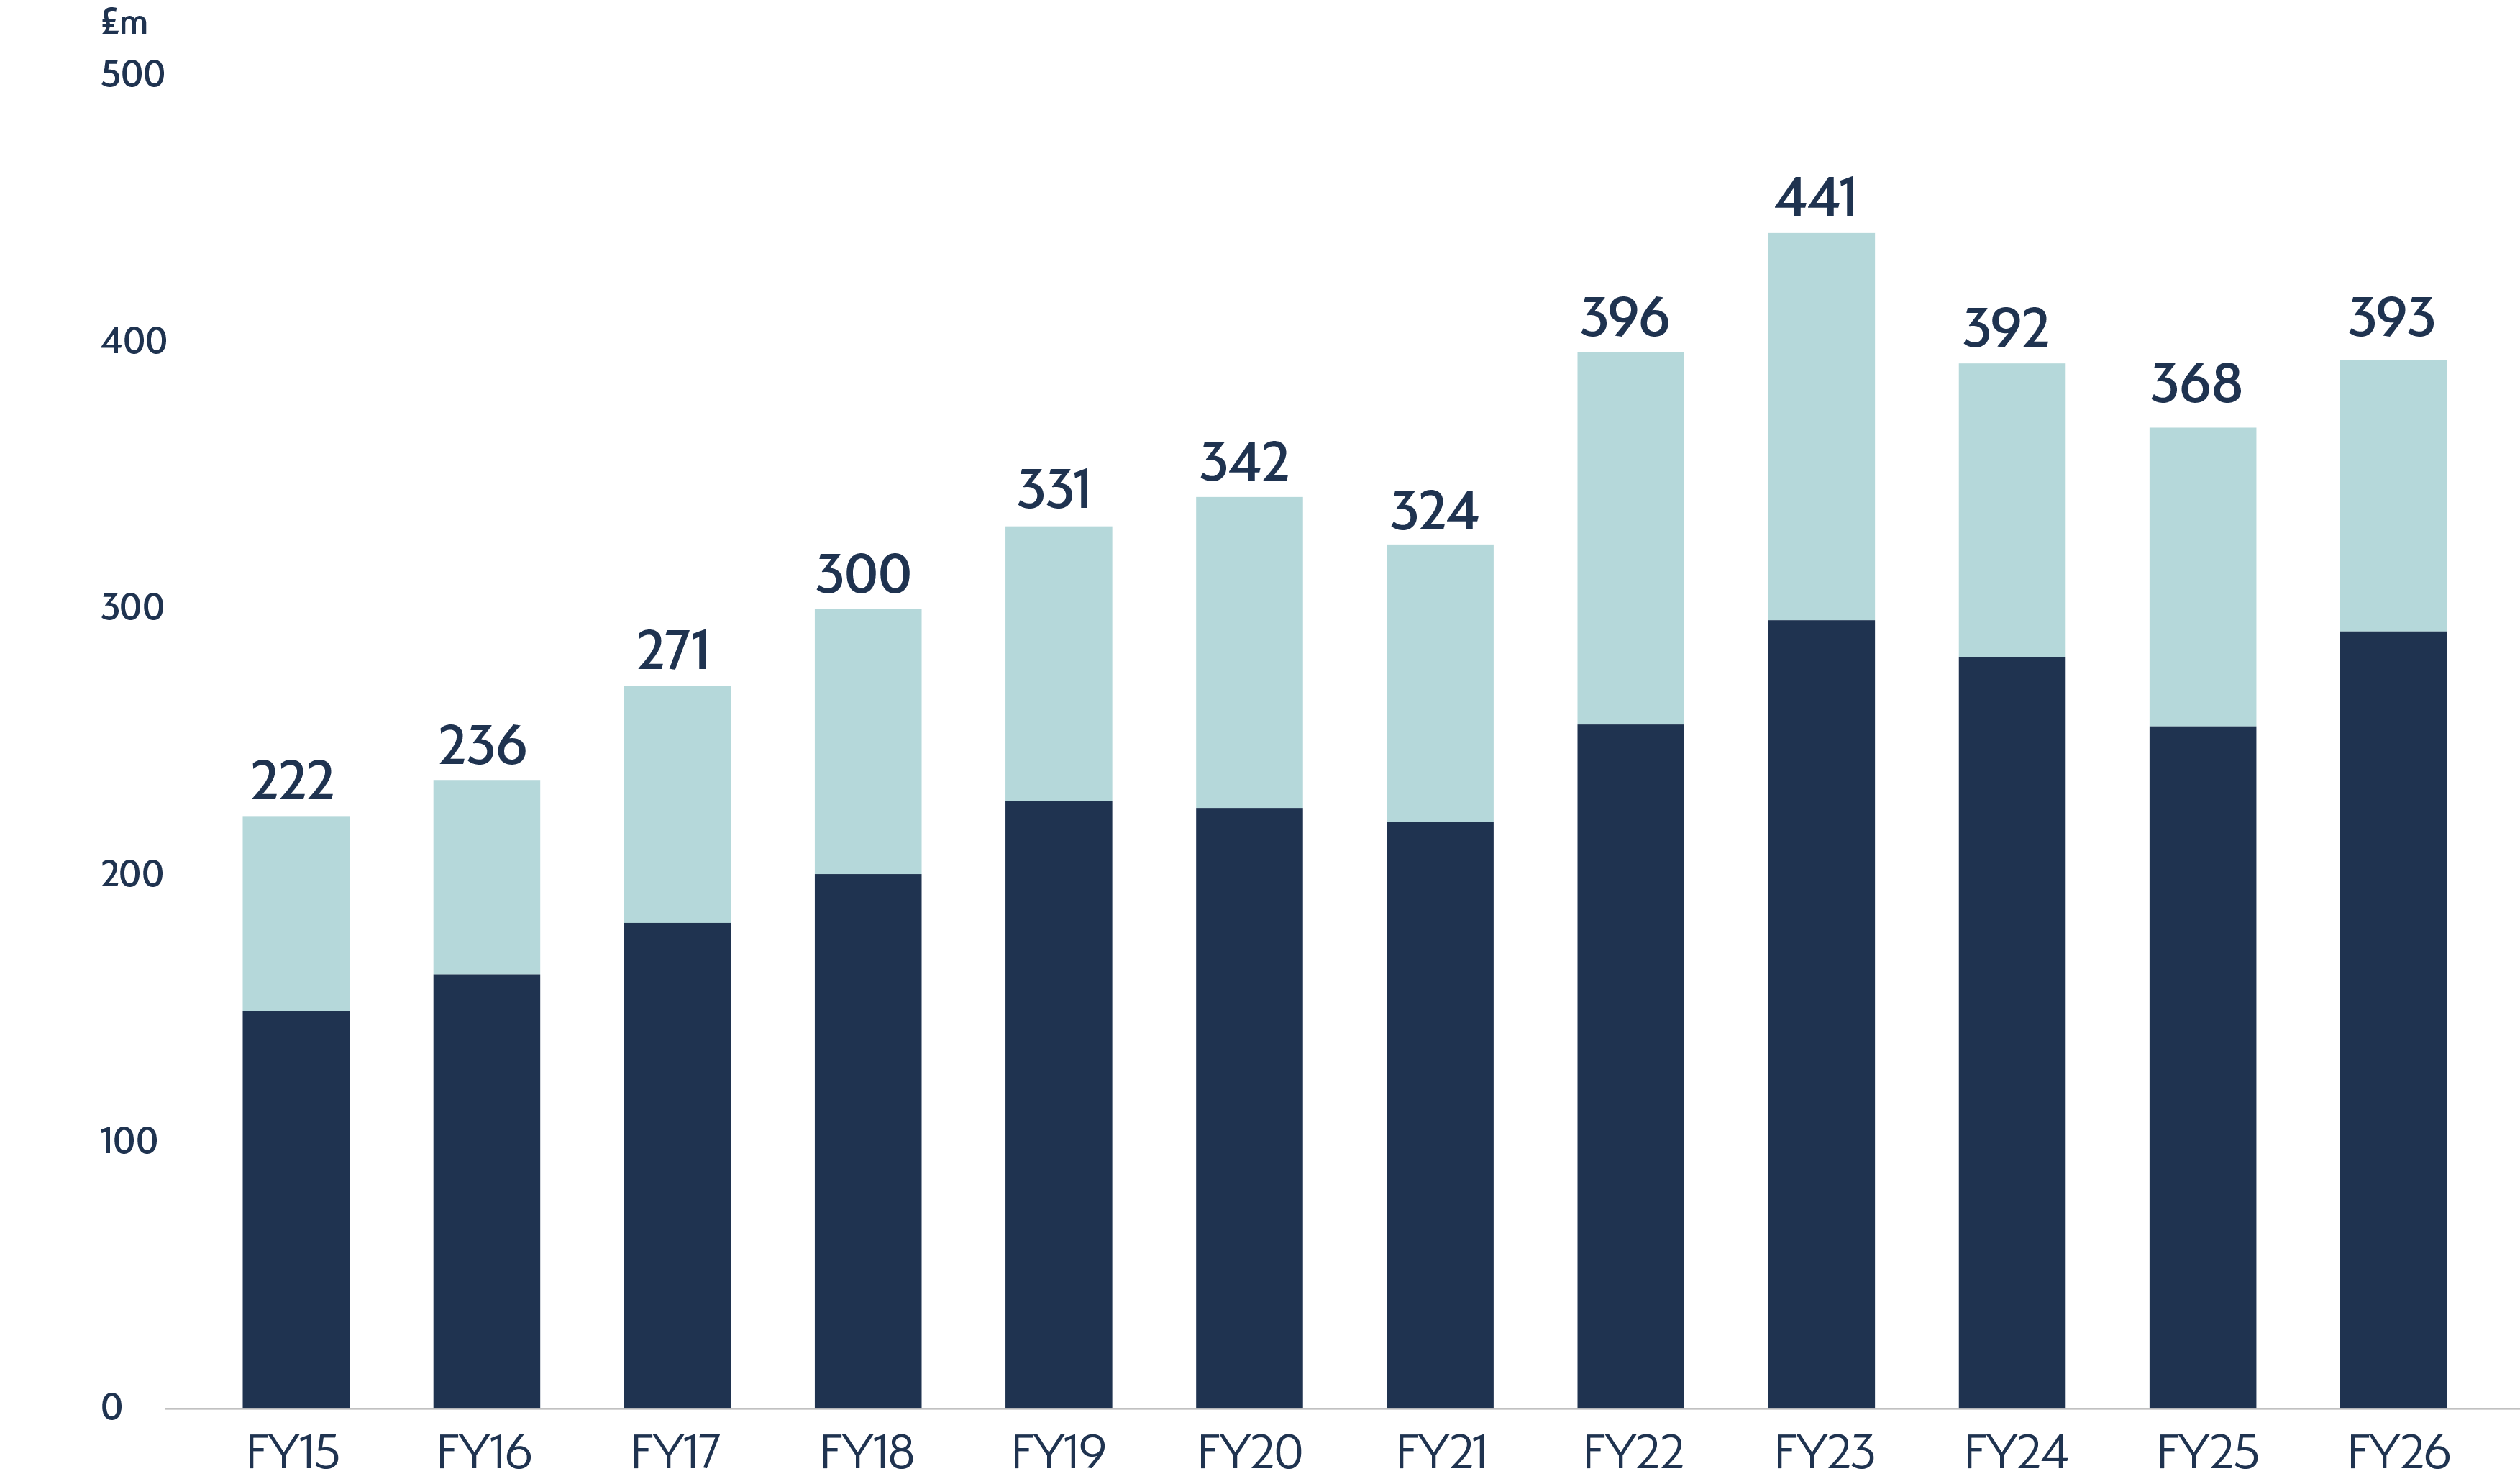
REVENUE (£M)
Europe
South Africa
Organic growth
enhanced by
successful acquisitions
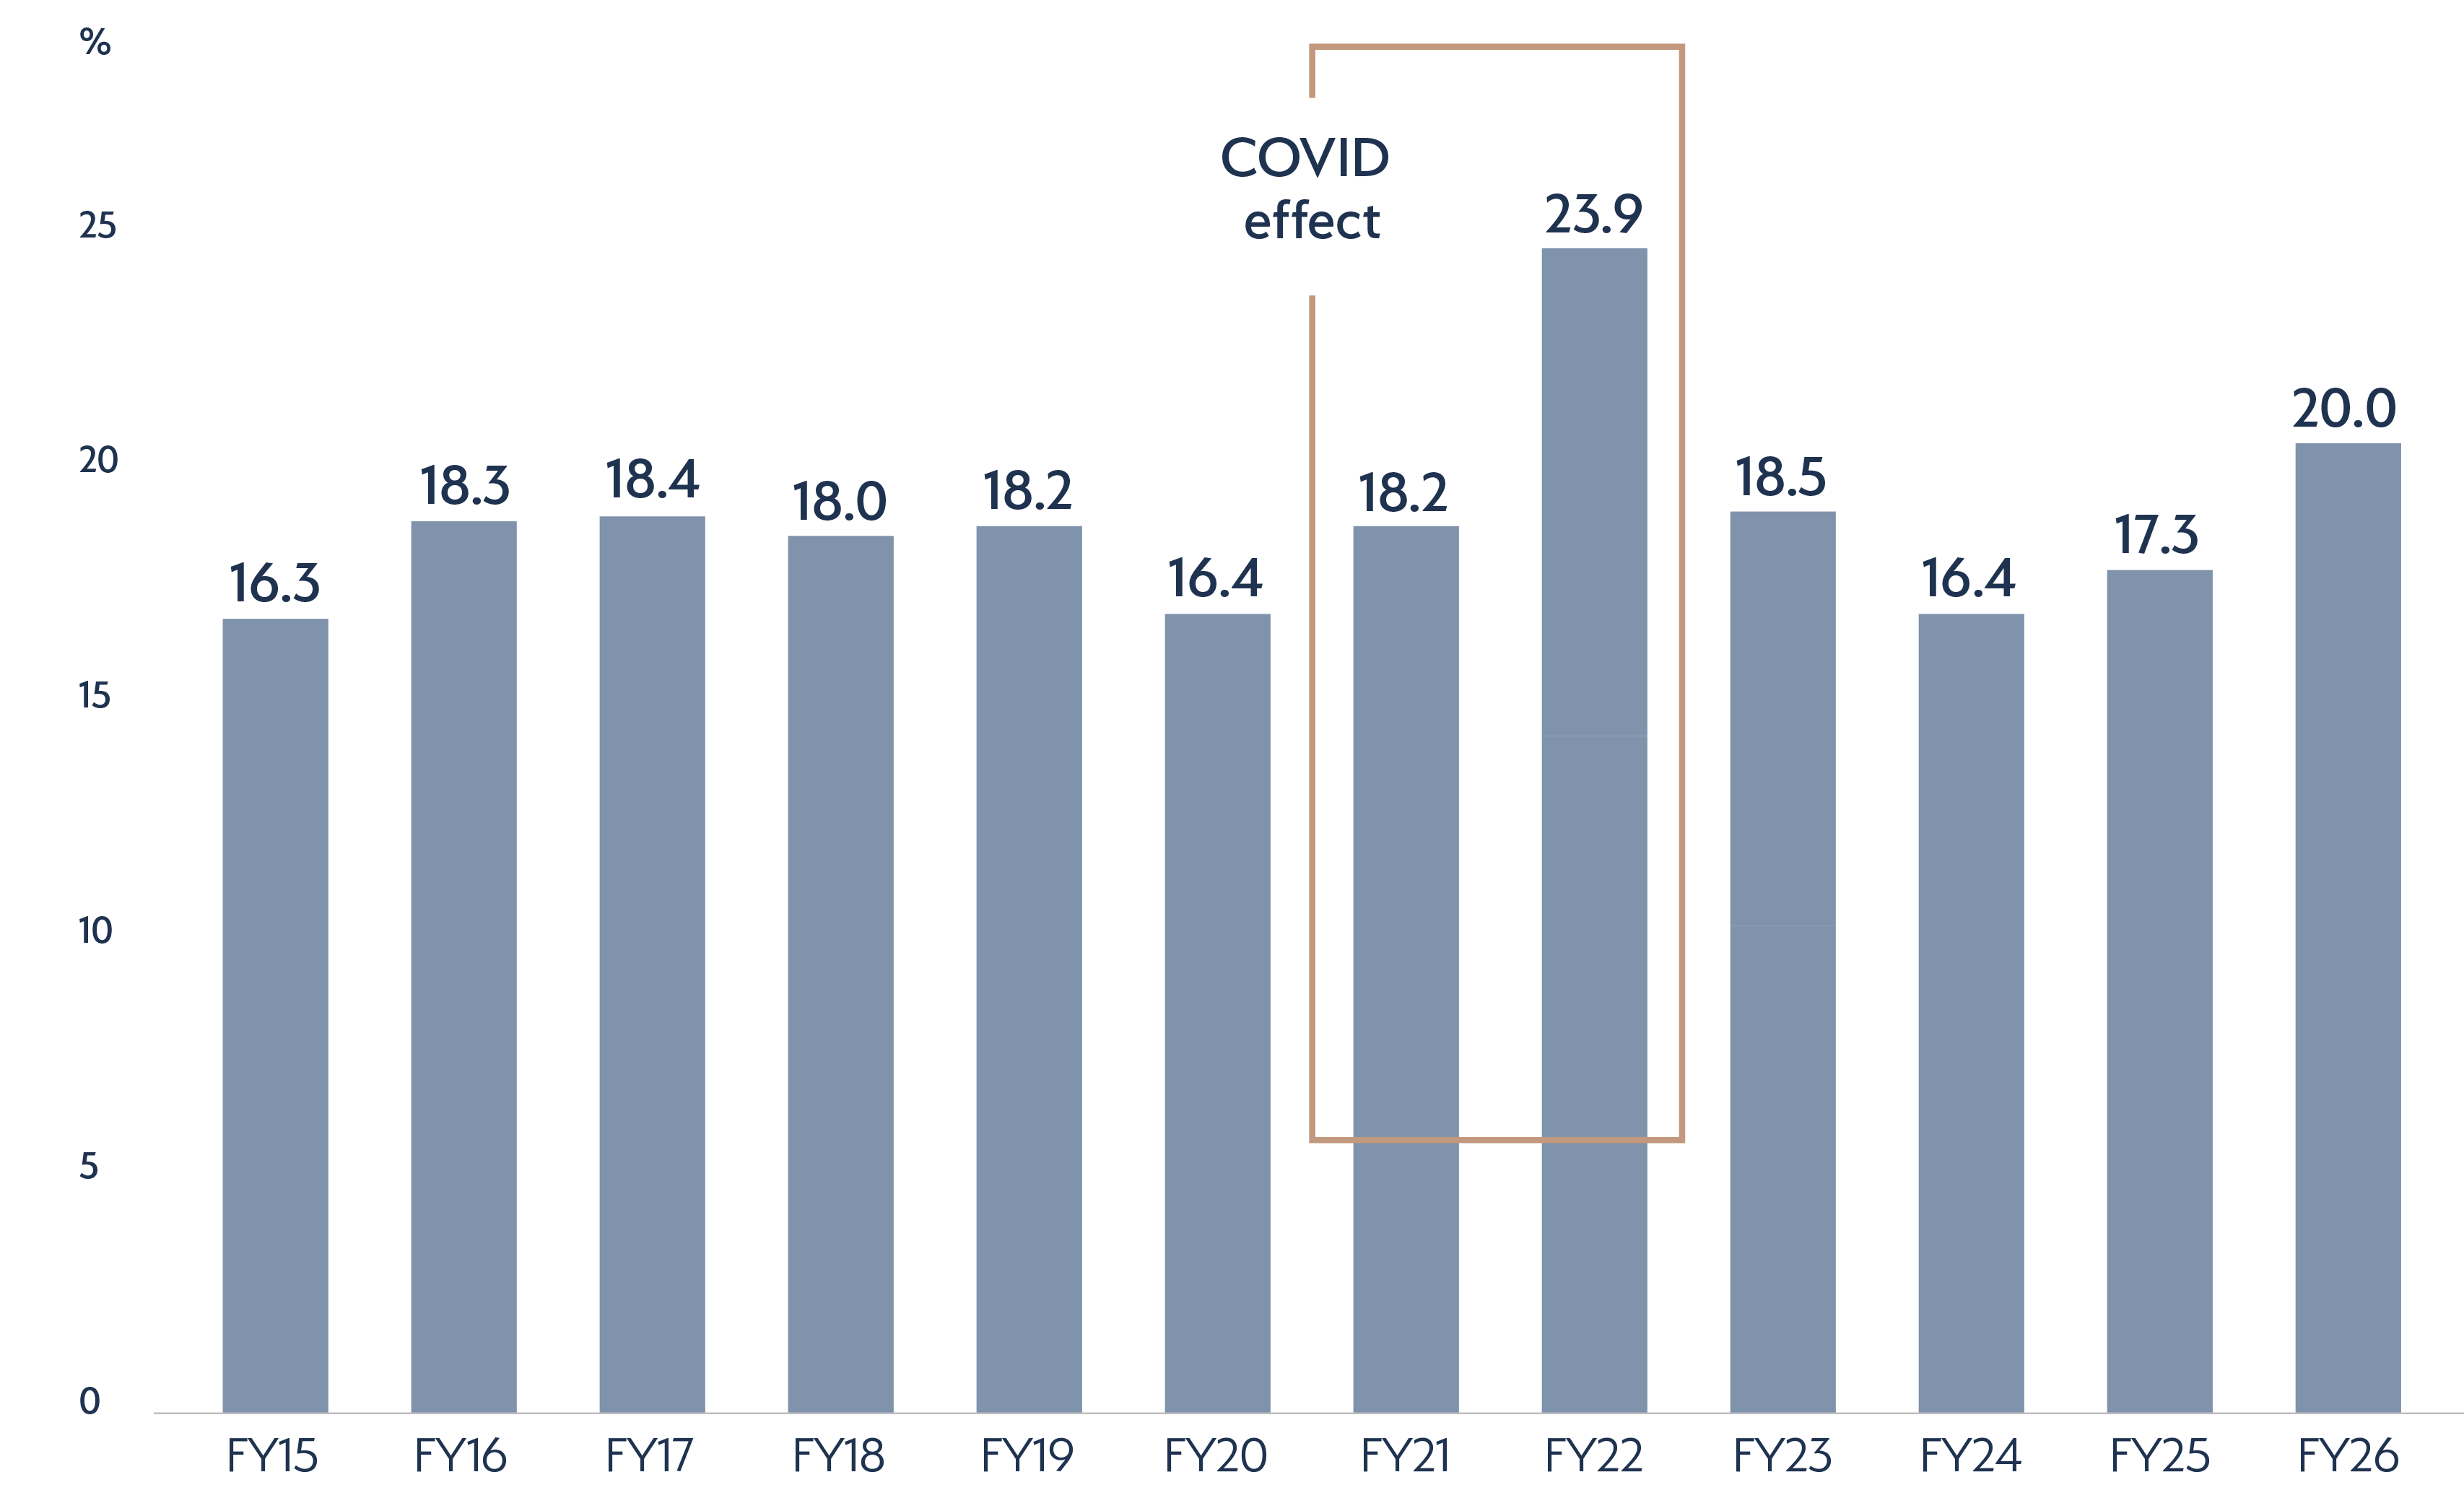
UNDERLYING RETURN ON CAPITAL EMPLOYED (%)
Consistently
achieved a
strong return on
capital
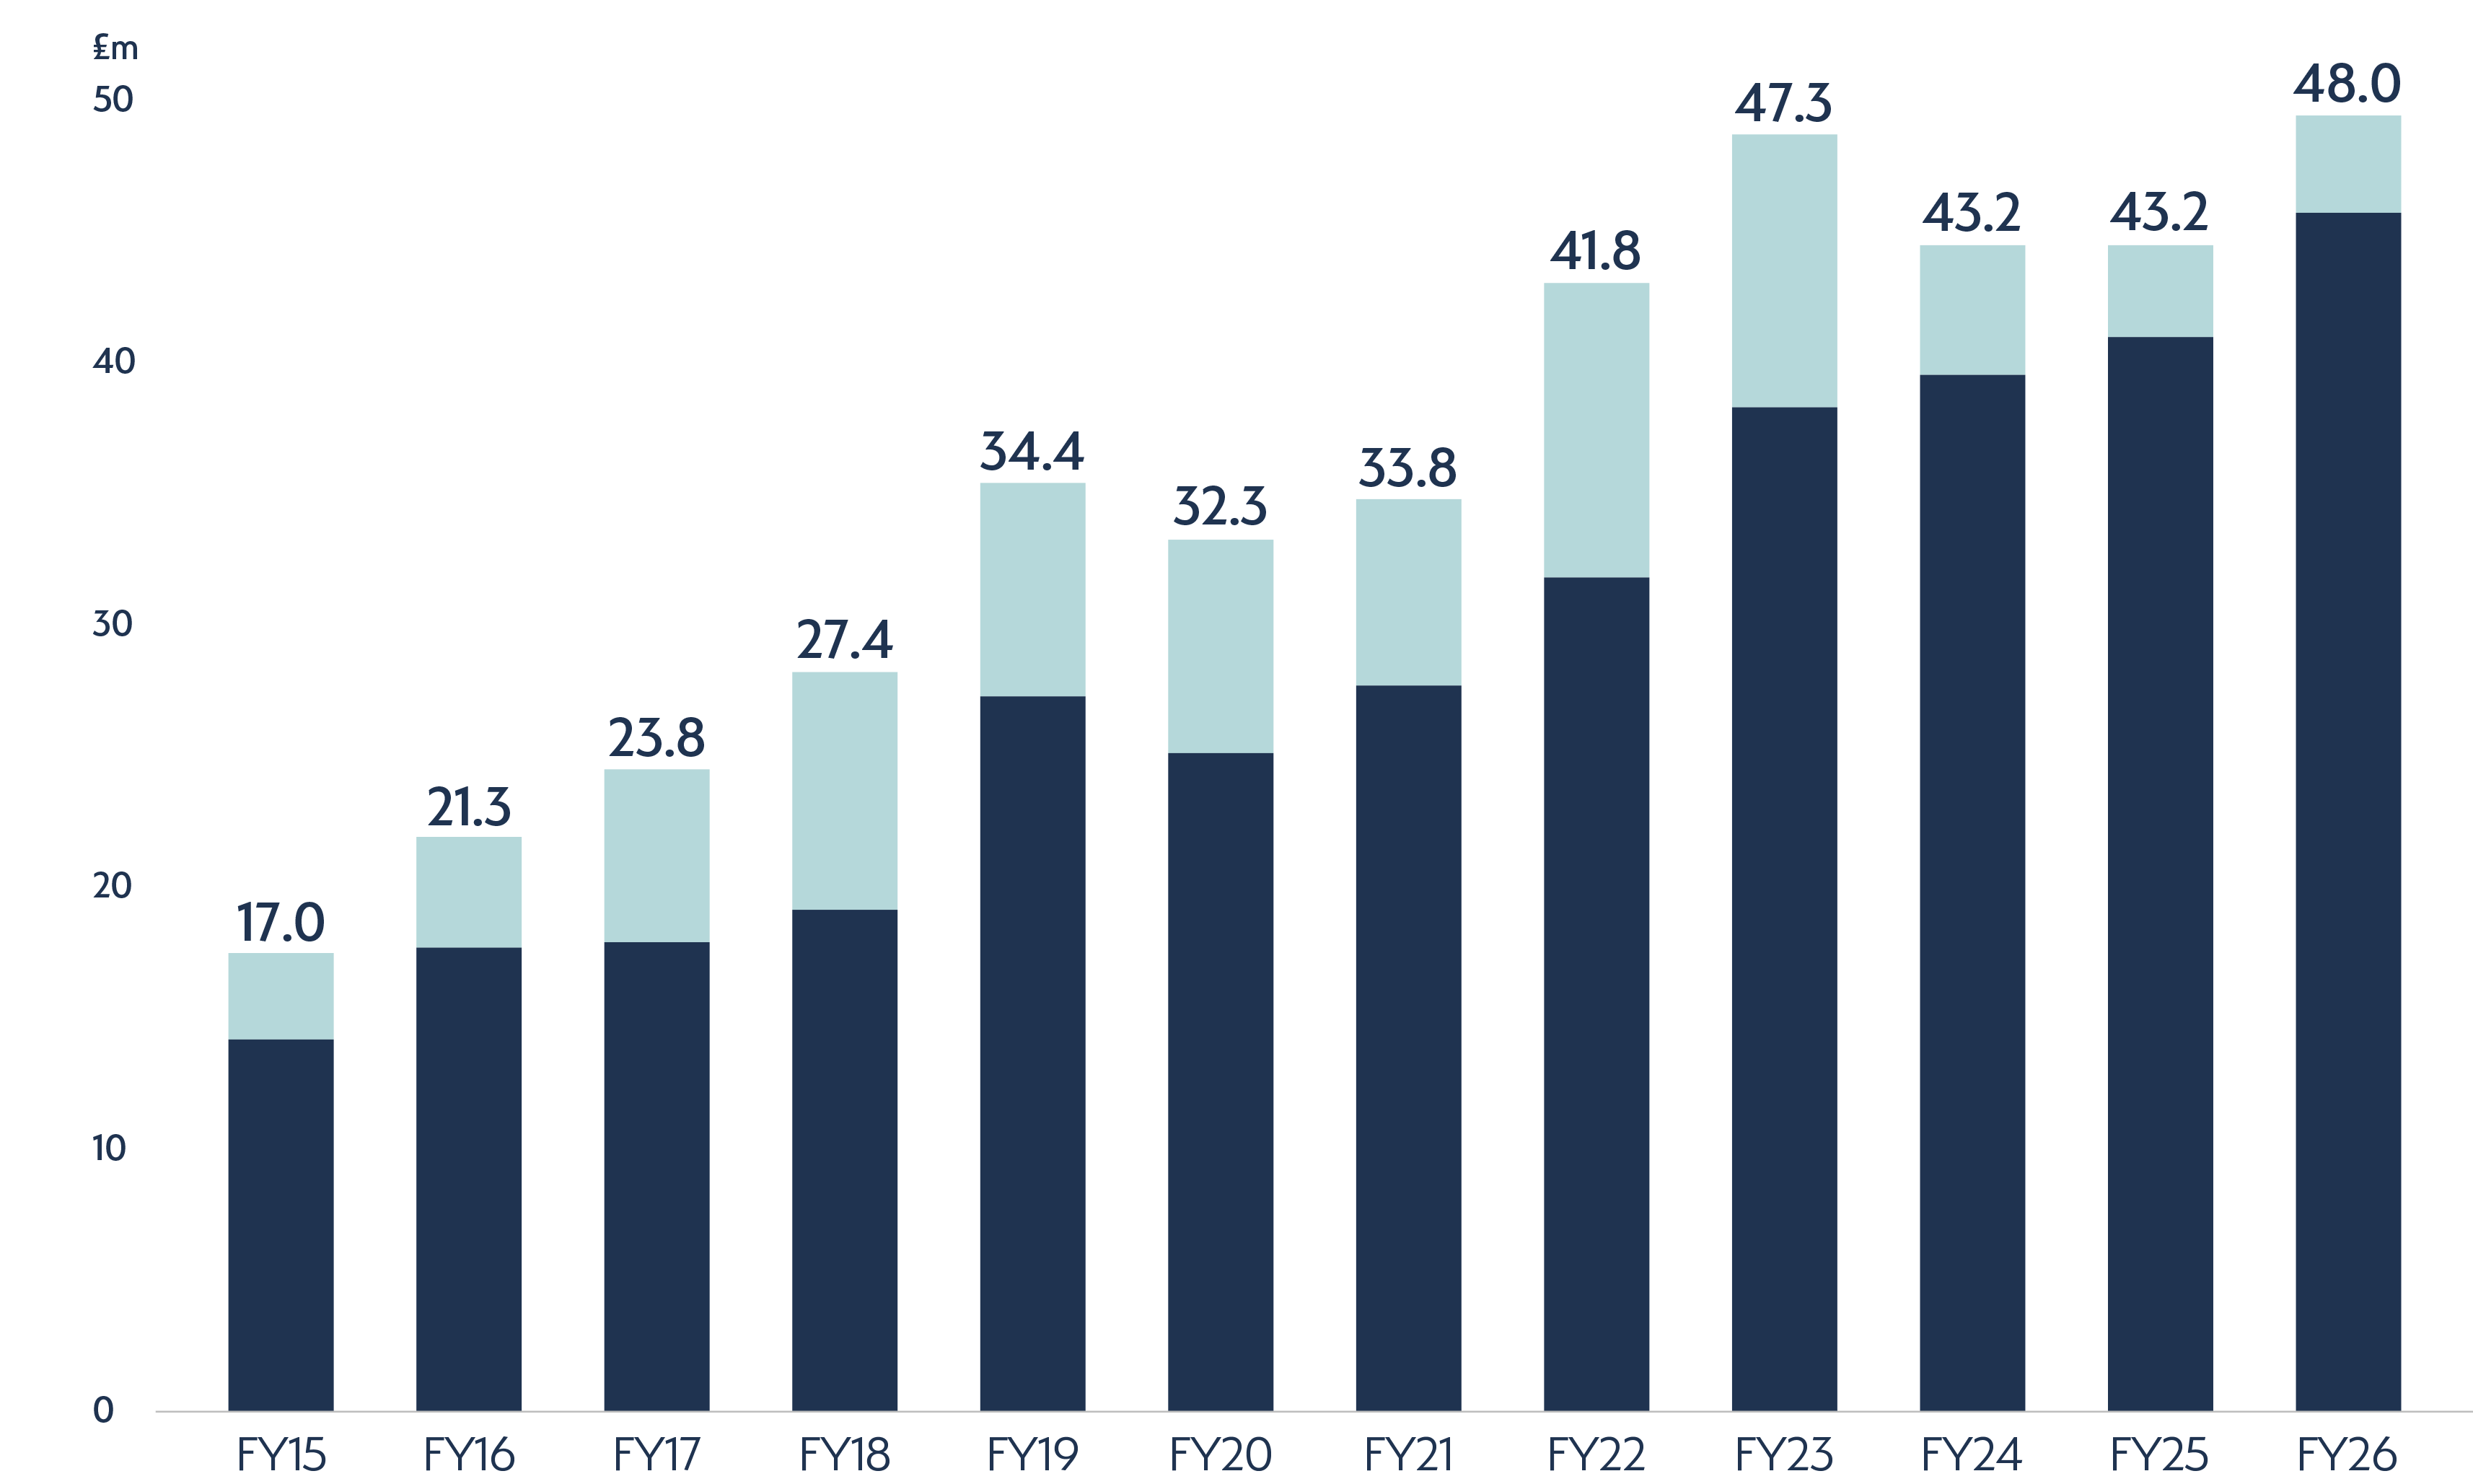
UNDERLYING OPERATING PROFIT (£M)
Europe
South Africa
Strong profit
post pandemic
enhanced by
Grant Westfield
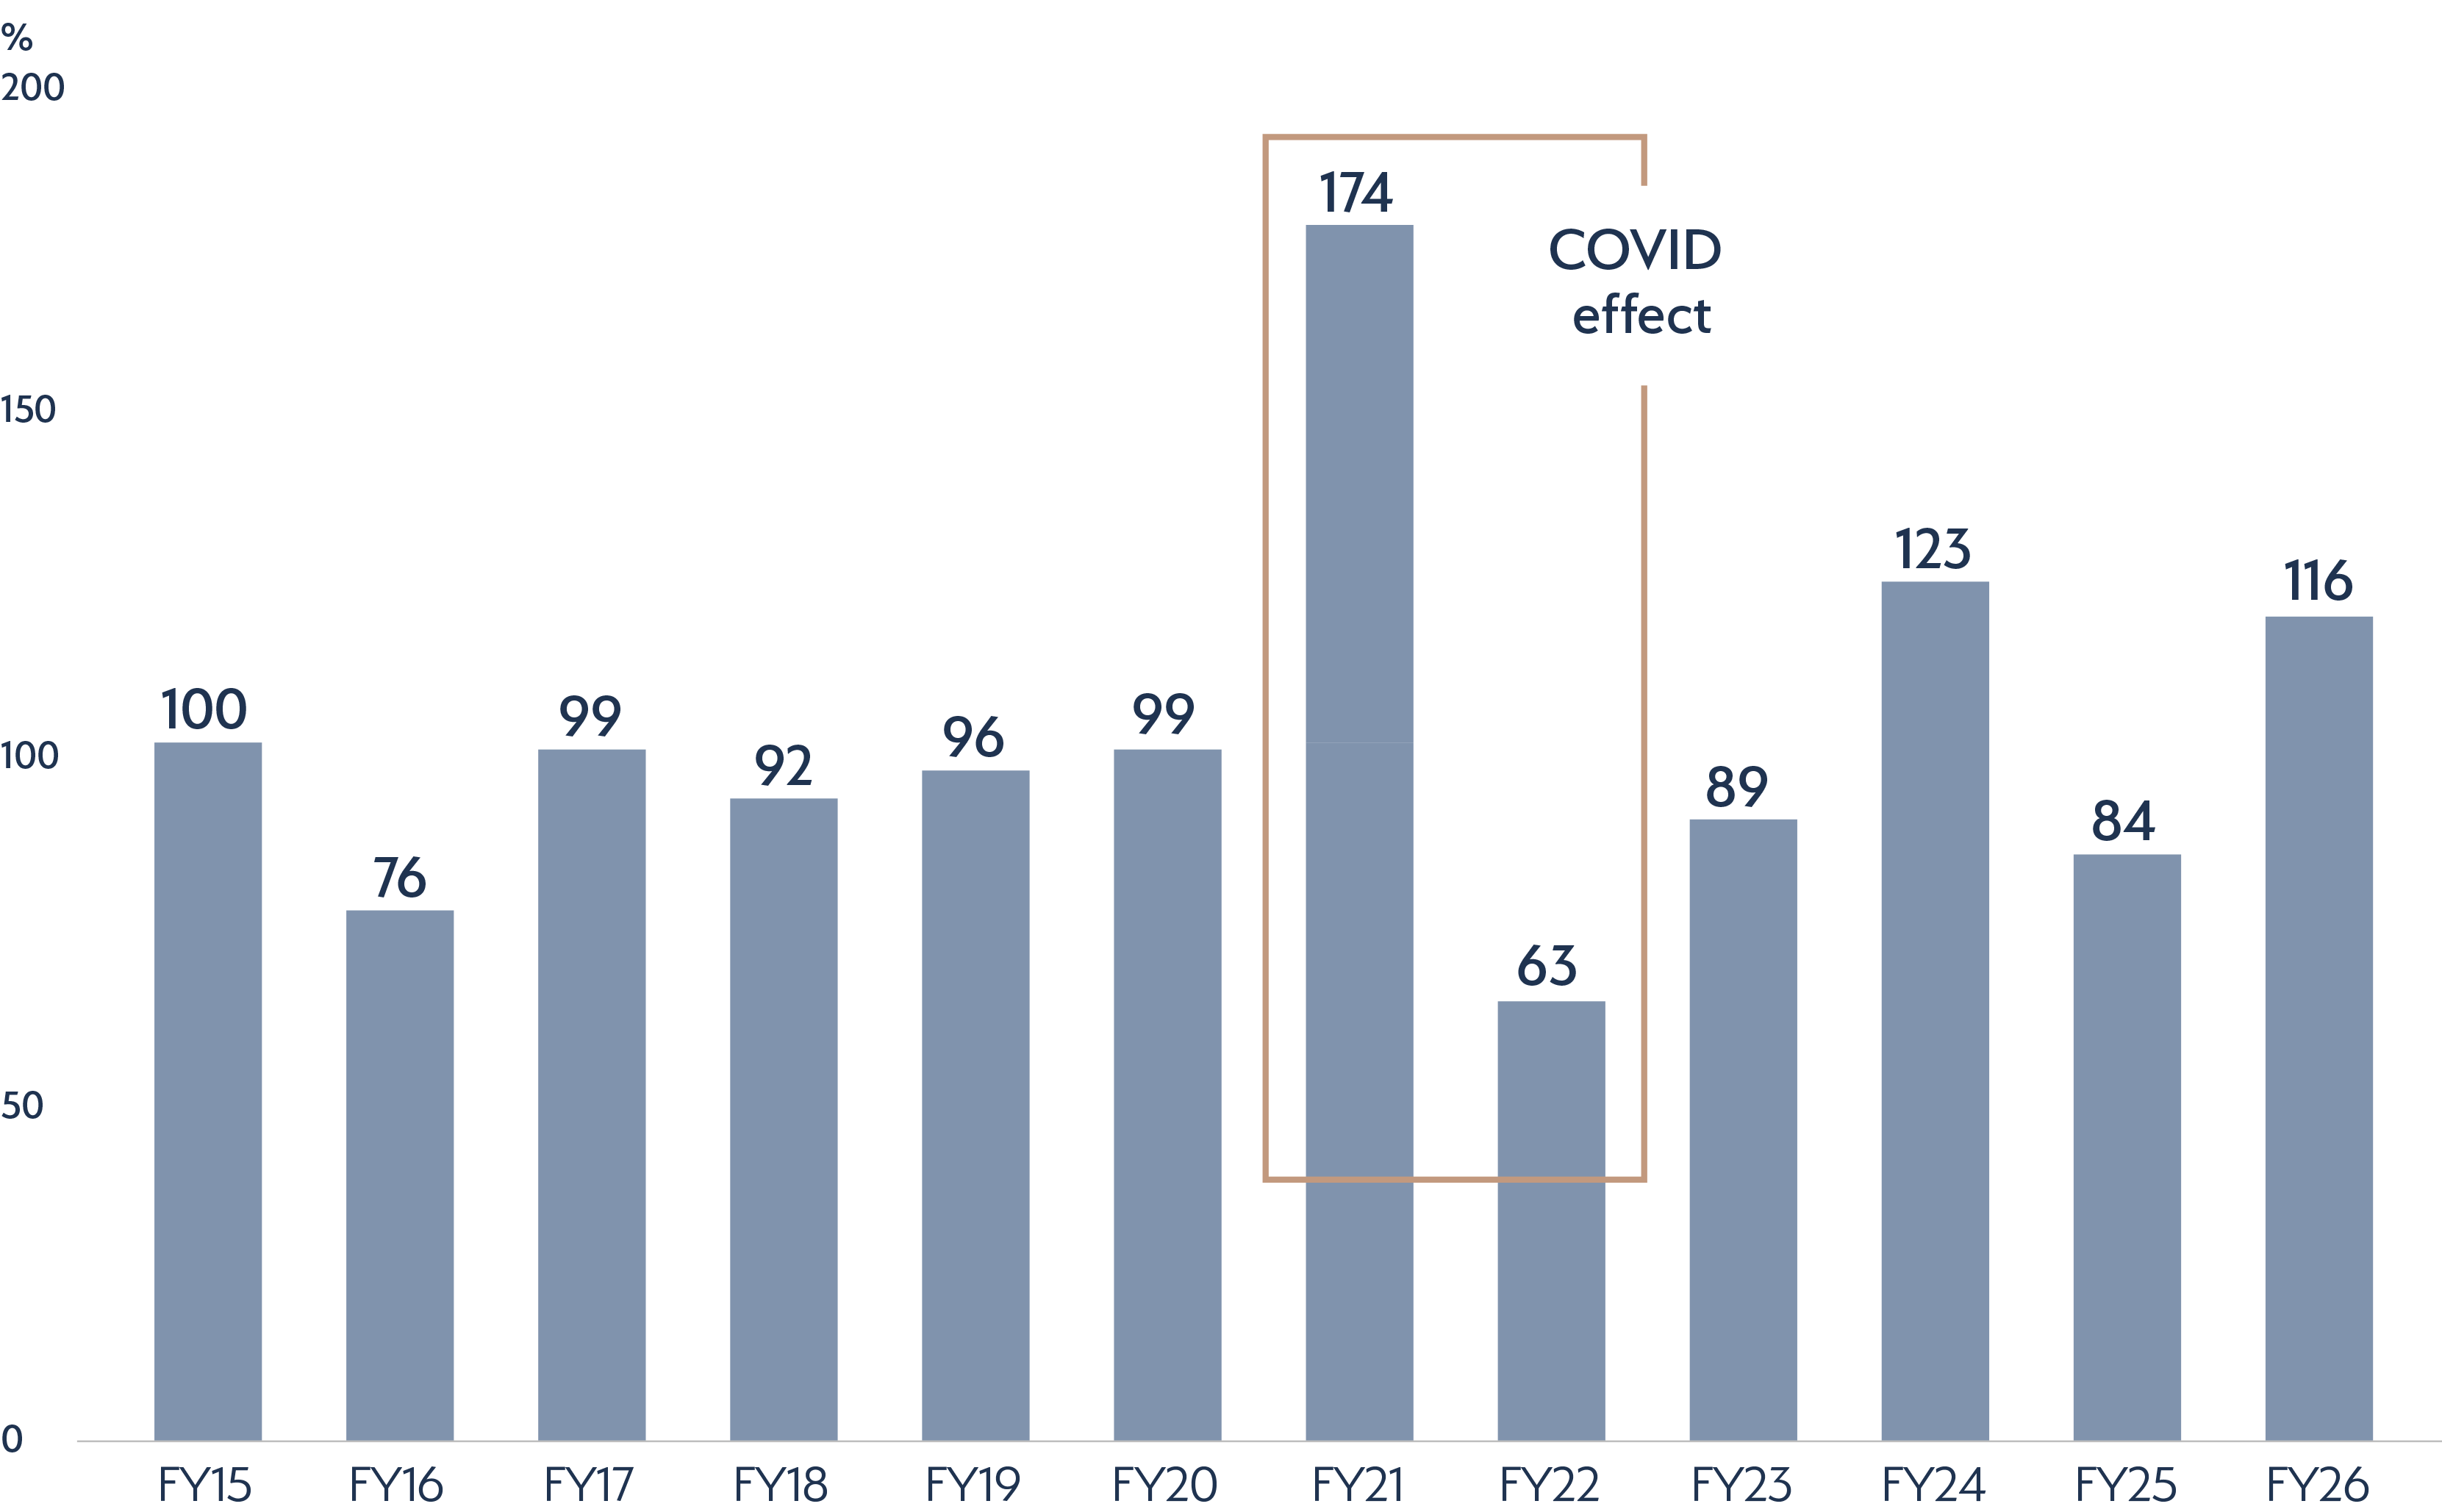
PRE-CAPEX CASH CONVERSION (% OF UNDERLYING EBITDA)
Consistently
high cash
conversion
1. Underlying means before exceptional operating items, IAS 19R admin costs, acquisition-related costs and where relevant, non-cash finance costs.
2. Comparisons have not been restated for Johnson Tiles SA (discontinued operations) to allow consistency in previous years